When refining a mesh to achieve convergence, it is possible that the stress values will diverge as the mesh becomes more refined due to a stress singularity. This article explains a few signs that can indicate the presence of a stress singularity, and how to use the “Stress Hot Spot” tool in SOLIDWORKS Simulation to distinguish between stress singularities and stress concentrations.
The Stress Hot Spot functionality is only available with linear static studies that use solid and shell mesh elements.
Case Study: Simple Bracket
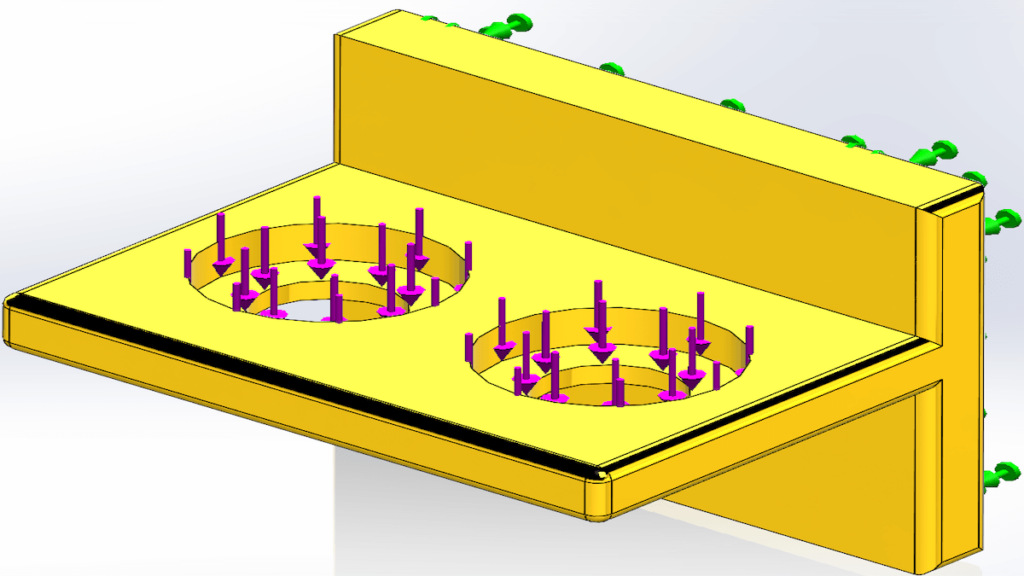
The bracket below is simply fixed on the back face, and a vertical force of 10,000 N is applied to the counterbore faces, shown in figure 1.
The mesh was refined twice after the initial coarse analysis and the results are shown below, graphically in figure 2 and numerically in table 1.
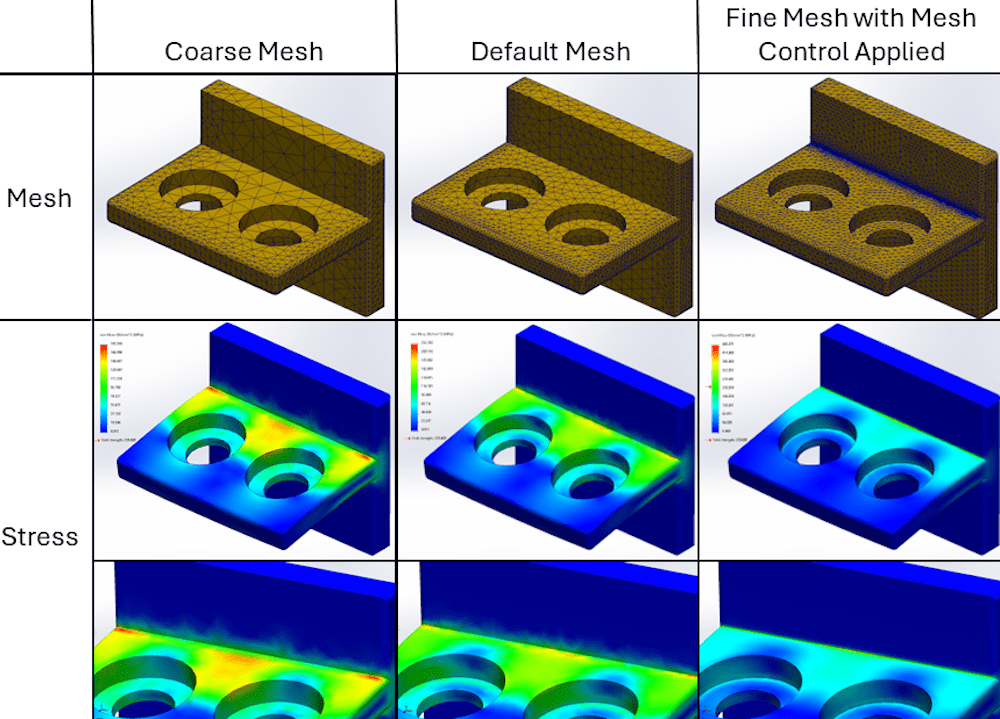
Table 1: Mesh refinement study results
| Study | Max Displacement [mm] | Increase in Max. Displacement [%] | Max. Von Mises Stress [MPA] | Increase in Von Mises Stress [%] |
| Coarse Mesh | 0.540219 | – | 185.548 | – |
| Default Mesh | 0.550922 | 1.981% | 232.35 | 25.224% |
| Fine Mesh with Mesh Control Added | 0.561431 | 1.908% | 460.075 | 98.009% |
Figure 2 shows the same study done with 3 different meshes, each represented in a column. The top row shows each mesh, while the bottom two rows show the stress plots. Table 1 shows that the maximum displacements of each study are not very different from each other, a < 2% change, but as the mesh is refined, the stress results diverge dramatically. This large divergence of stress (but not displacement) is a tell-tale sign of a stress singularity. An additional (but less obvious sign) is the uneven stress distribution along the edge of interest, which is shown by an irregular and non-uniform coloring.
At this point, it’s a good time to run a stress hot spot analysis. The Stress Hot Spot diagnostics tool detects regions of the model where stress gradients between adjacent elements are irregular. In certain cases, these irregular high-stress gradients can be attributed to stress singularities. This could be done on any of the 3 studies, but we will use the finest mesh to start with.
First, right-click the results folder and select the “Stress Hot Spot Diagnostics.” This will bring up the PropertyManager to start the test.
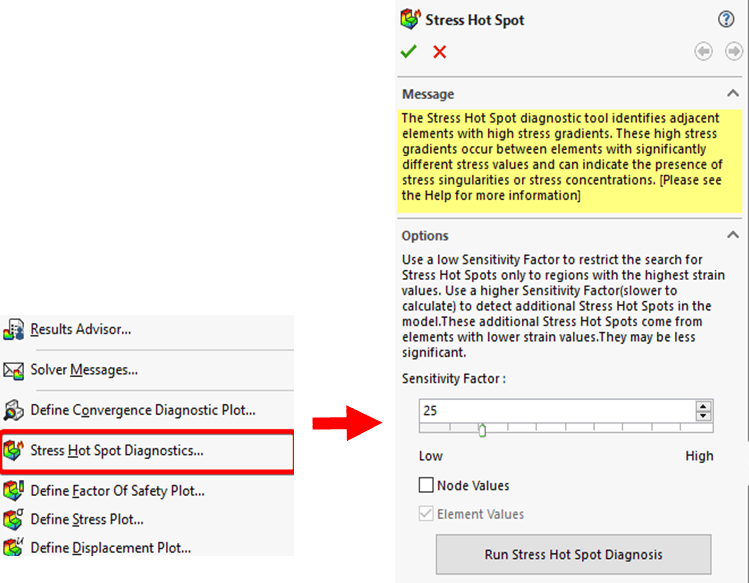
In the PropertyManager, you’ll see a sensitivity factor that can be adjusted. Generally, it is okay to accept the default value here, but you can increase this value to achieve more accurate results. The sensitivity factor filters the elements that participate in the stress hot spot diagnosis based on the magnitude of the equivalent strain relative to the maximum equivalent strain for each body.
Basically, as the sensitivity factor is increased, more elements are analyzed at the expense of computational efficiency. There is also an option to view the stresses at each node or as the calculated element value. Elemental plots display one stress value for each element, while plots display one stress value for each node. Click on the “Run Stress Hot Spot Diagnosis” option, and if there is a hot spot you should see the message shown below in figure 4:
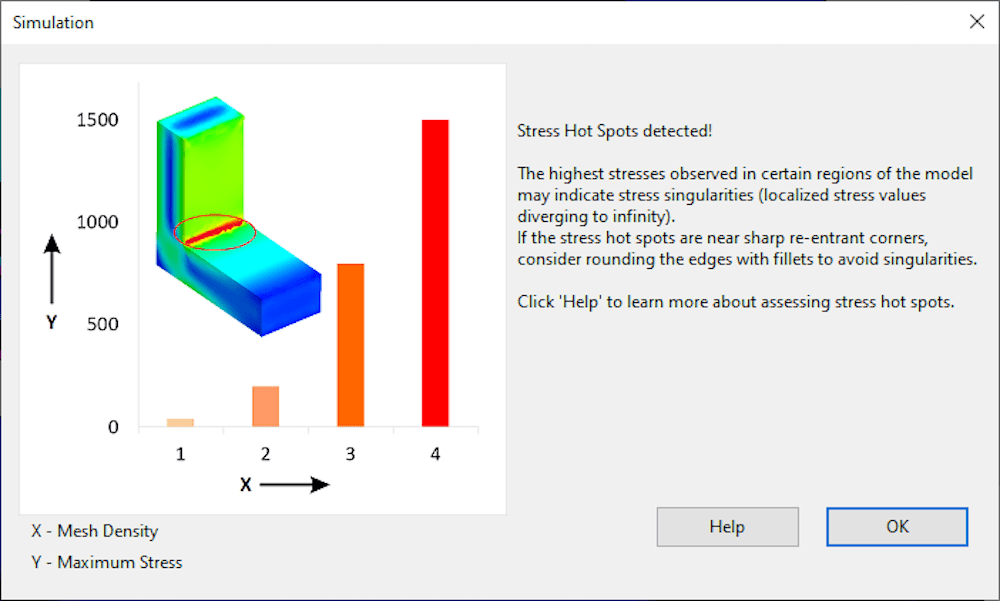
Push “OK” to bring up the diagnostic PropertyManger, seen below in figure 5.
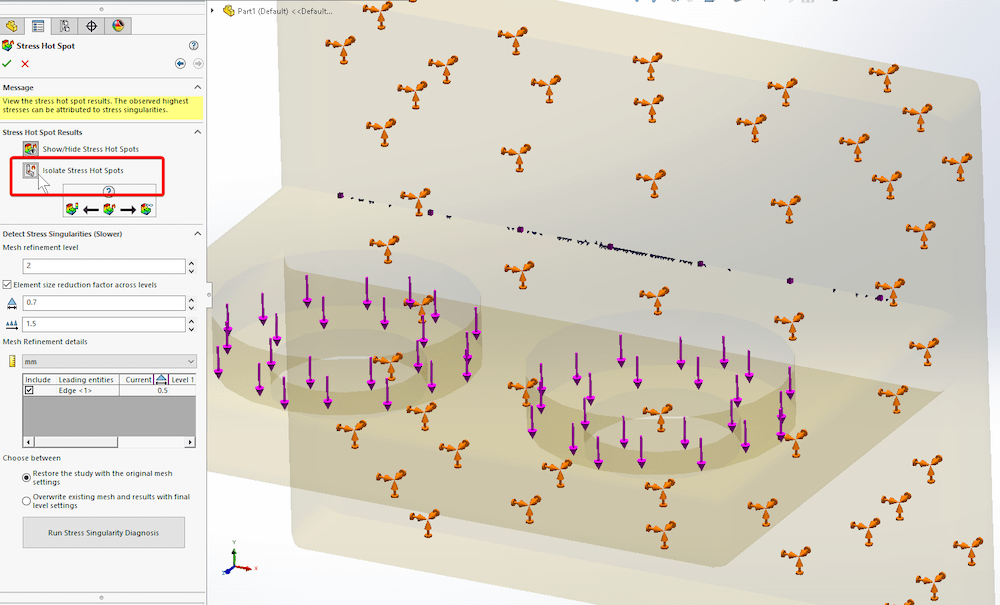
At the top of the PropertyManager, there is an option to isolate the stress hot spot elements. This will apply transparency to the entirety of the model, except for the elements that are associated with the hot spot(s). Moving down the PropertyManager, there is a “Mesh refinement level” option that can be set to either 2 or 3. This is telling the software how many more times to refine the mesh and attempt to achieve convergence or confirm that the selected location(s) are in fact stress singularities. Then there are settings specific to how each element will be refined. By checking the “Element size reduction factor across all levels” option, a uniform element refinement is applied to each new mesh. These values are shown in the “Mesh Refinement details” section, where an element size reduction factor can be specified for each new mesh individually if desired.
The element size growth ratio value is applied to all successive mesh layers. The “Mesh Refinement details” section also shows all entities where a stress singularity is detected, and the mesh refinement will be added to confirm. There is an option at the bottom of the PropertyManger to save the refined mesh as your new mesh once the study is complete or revert to your original mesh. Finally, click the “Run Stress Singularity Diagnosis” option at the bottom of the PropertyManager to begin the mesh refinement process.
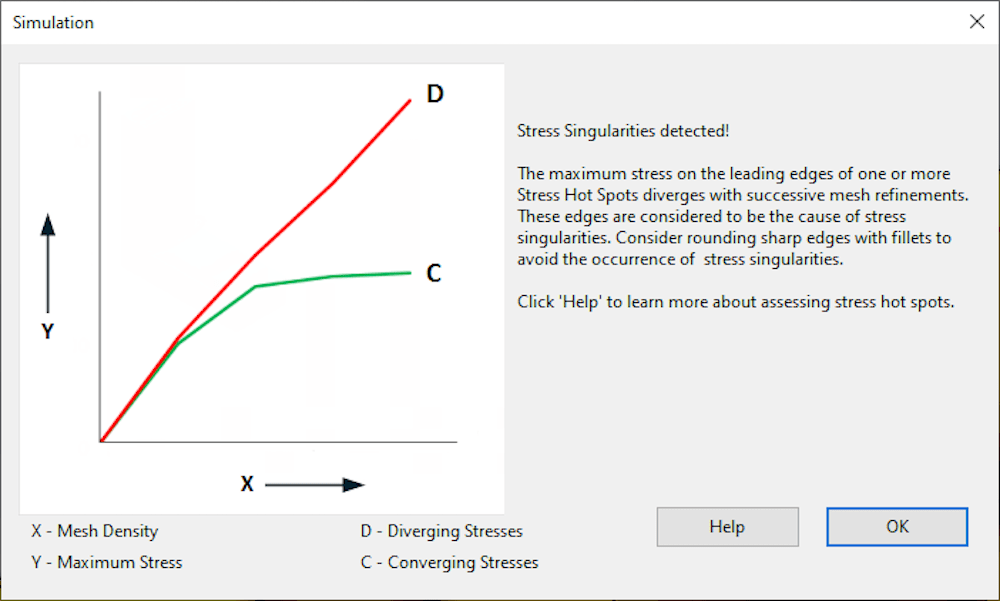
Once the study completes and if a stress singularity is found, the message “Stress Singularities detected!” will appear as shown below in figure 6.
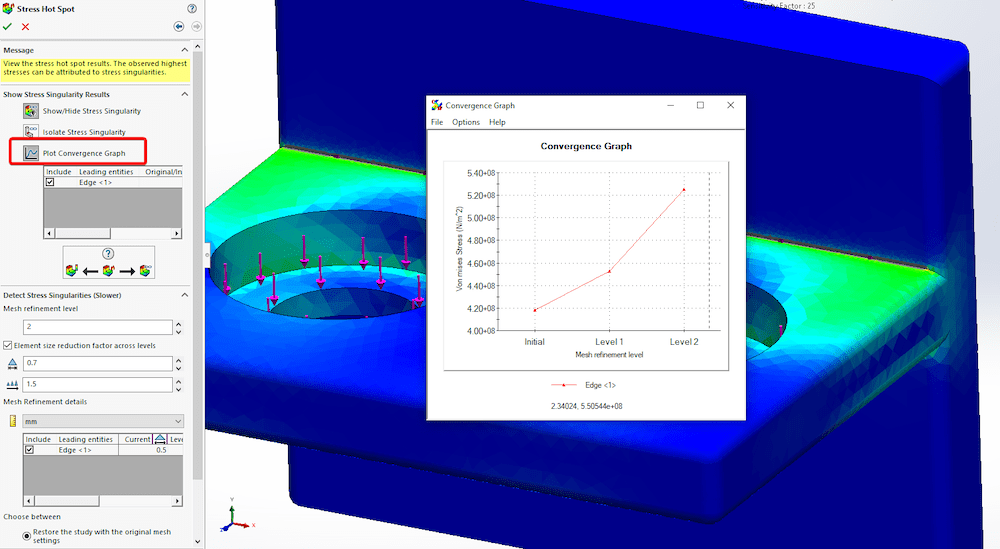
At this point, there is now an available option to “Plot Convergence Graph” that shows how the stress results varied on each entity of interest through the mesh refinement. This is shown below in figure 7.
And that’s it! There is now confirmation that the results observed are due to stress singularities, and not stress concentrations. You can choose to refine your model to avoid the hot spots by applying a fillet to a sharp re-entrant corner, or even easier, just ignore the results at those areas if they are not at locations of concern.
One last thought, it is sometimes better to begin your hot spot diagnosis with a more refined mesh instead of a course one. Redoing this case study, but with the coarse mesh, you can see more edges were originally detected as possible hot spot locations. This could be indicative of a mesh that is too course and not necessarily a real stress singularity. See figure 8 below.
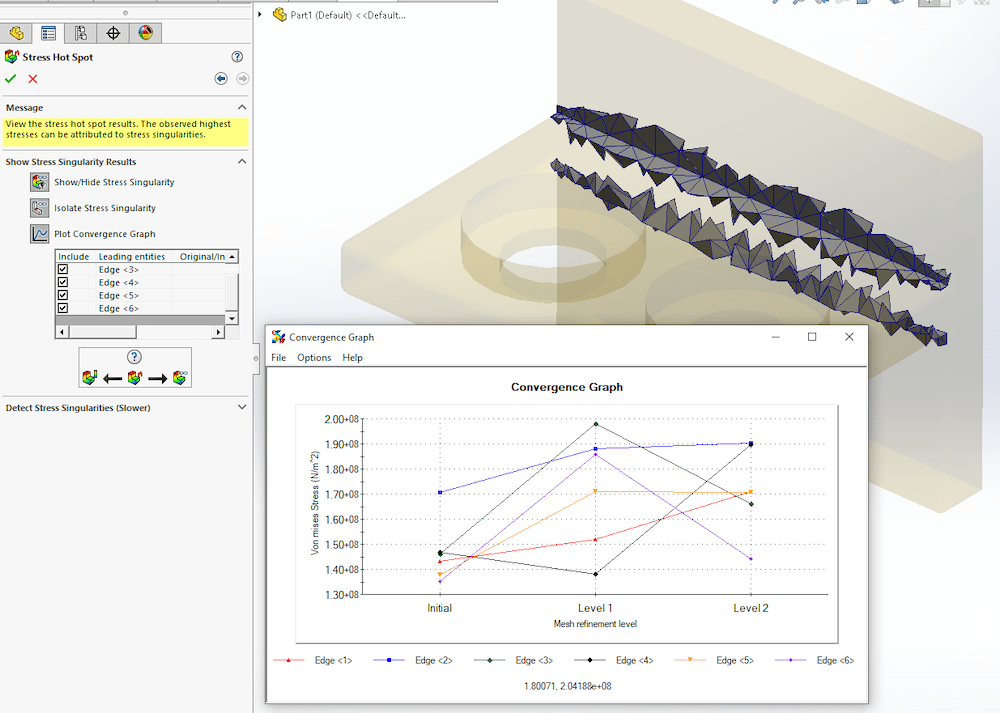
This hot spot study found 6 edges of interest instead of one, and the results are a little less clear as to which edge is the culprit. That is why it is recommended to begin the hot spot study on a more refined mesh.
Learn Even More Tips and Tricks in SOLIDWORKS Simulation
Hopefully after reading this, you have a good understanding of how to locate the presence of a stress singularity and how to use the “Stress Hot Spot” Tool in SOLIDWORKS Simulation to distinguish between stress singularities and stress concentrations.
Interested in learning more? Check out our YouTube channel or contact us at Hawk Ridge Systems today. Thanks for reading!
The post How to Use the Stress Hot Spot Tool in SOLIDWORKS Simulation appeared first on Hawk Ridge Systems.